Numeracy for all (VSO)
|
|
Statistics and probabilityWritten by Jane Jones (University of Winchester) and Clare Tope (Open University) 1.0 OverviewStatistics provides a way of gathering, presenting, analysing and interpreting data to solve real life problems. If at all possible, children should play some part in deciding what questions to investigate, as Nickson (2004:34) states ‘it is the use of real data that motivates children’. There should be some progression in the types of questions tackled. In Key Stage 1 these should be fairly simple factual questions, such as, how many children are having a packed lunch today? In order to answer this question, children first sort the class into 2 sets, those who have packed lunches and those who do not. These sets can then be represented in graphs or charts so the answer to the question can be interpreted. Lessons on data handling should include opportunities for children to interpret information on a range of different kinds of graphs. Statistics is possibly the only area of mathematics that can be taught through a totally cross- curricular approach; indeed, it can possibly only be taught in this way (Cotton, 2016). The teacher’s role is to consider the sorts of questions which will provide rich starting points for children’s learning (Pepperell et al, 2009). For more information about how to teach statistics across the curriculum please see:http://www.mathematicshed.com/uploads/1/2/5/7/12572836/how-to-teach-data-handling-across-the-curriculum1.pdf For ideas about how to involve children in the collection and presentation of data please see: https://www.nurseryworld.co.uk/features/article/learning-development-data-handling-in-the-charts 2.0 Key Ideas2.1 Types of dataChildren will collect different kinds of data.
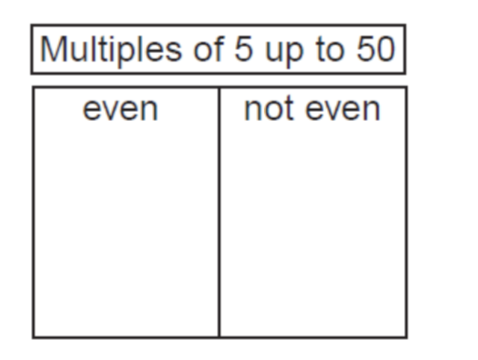
2.2 Representing dataGraphs are used to communicate data to an audience. Care has to be taken to use an appropriate form of representation to allow information to be communicated clearly, accurately and attractively (Orton and Frobisher, 2005). Therefore, it is important that children are given opportunities to choose and use a range of representations. Carroll diagrams Carroll diagrams represent the outcomes of sorting data according to whether they possess a particular attribute or not.
Venn diagrams Venn diagrams represent the outcomes of sorting a set of data according to two or three criteria. Venn diagrams allow for the comparison of sets of data. The properties that the groups have in common are placed in the intersection of the two Venn rings. For example the numbers in the intersection below are even numbers with a 3 in the tens digit.
Tally charts A mark is made as each items is counted. Every fifth mark is placed diagonally to indicate a group of 5.
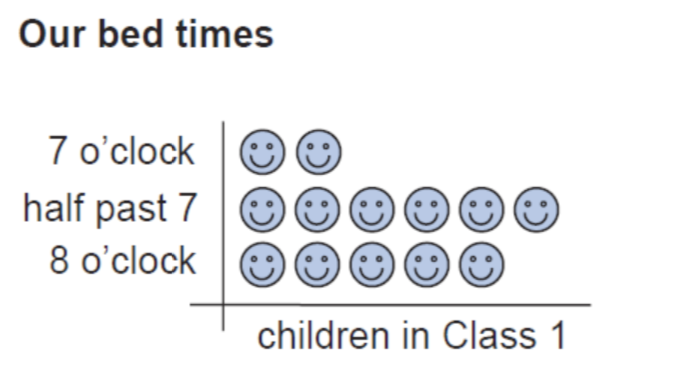
Pictograms Pictograms provide a way of representing discrete data, in which each object is represented by an individual picture or icon. Pictures can be arranged in either rows or columns.
Block diagrams This is an introductory way of representing discrete data in which each item is represented by an individual block or square.
Bar charts A graphical representation of data, where amounts are represented by the lengths of bars or columns.
Further information about how different types of data can be represented can be found on the NCETM website: https://www.ncetm.org.uk/resources/46451
2.3 Interpreting dataCollecting and representing data may take a considerable time, but it is important that the final stage of data handling is not forgotten. It is valuable for children to discuss the information displayed on the graphs they have produced. For young children the interpretation should be quite straight forward; simply asking children what they have found out. For example, some questions might be displayed beside a bar chart of pets. These might include ‘Which is the most popular pet?’ or ‘How many children have a cat?’ This might extend to asking children to compare frequencies. For example, how many more children have a pet dog than a pet cat? Finally, you might ask questions which invite children to speculate. For example, do you think the graph would look the same if we asked a different class? 3.0 ReferencesCotton, T. (2016)Understanding and Teaching Primary Mathematics. 3rdedn. Abingdon: Routledge. Nickson, M. (2004)Teaching and Learning Mathematics; a guide to recent research and its application 2ndedn. London: Continuum. Orton, A. and Frobisher, L. (2005) Insights into Teaching Mathematics. 2ndedn. London: Continuum. Welsh Assembly Government (2009) How to teach handling data across the curriculum. Pepperell, S., Hopkins,C., Gifford, S. and Tallant, P. (2009) Mathematics in the primary school: A sense of progression. London: David Fulton. Sargent, M. (2013) Learning & Development: Data Handling - In the charts. Nursery World.
|


